
Snowflake Cost Observability
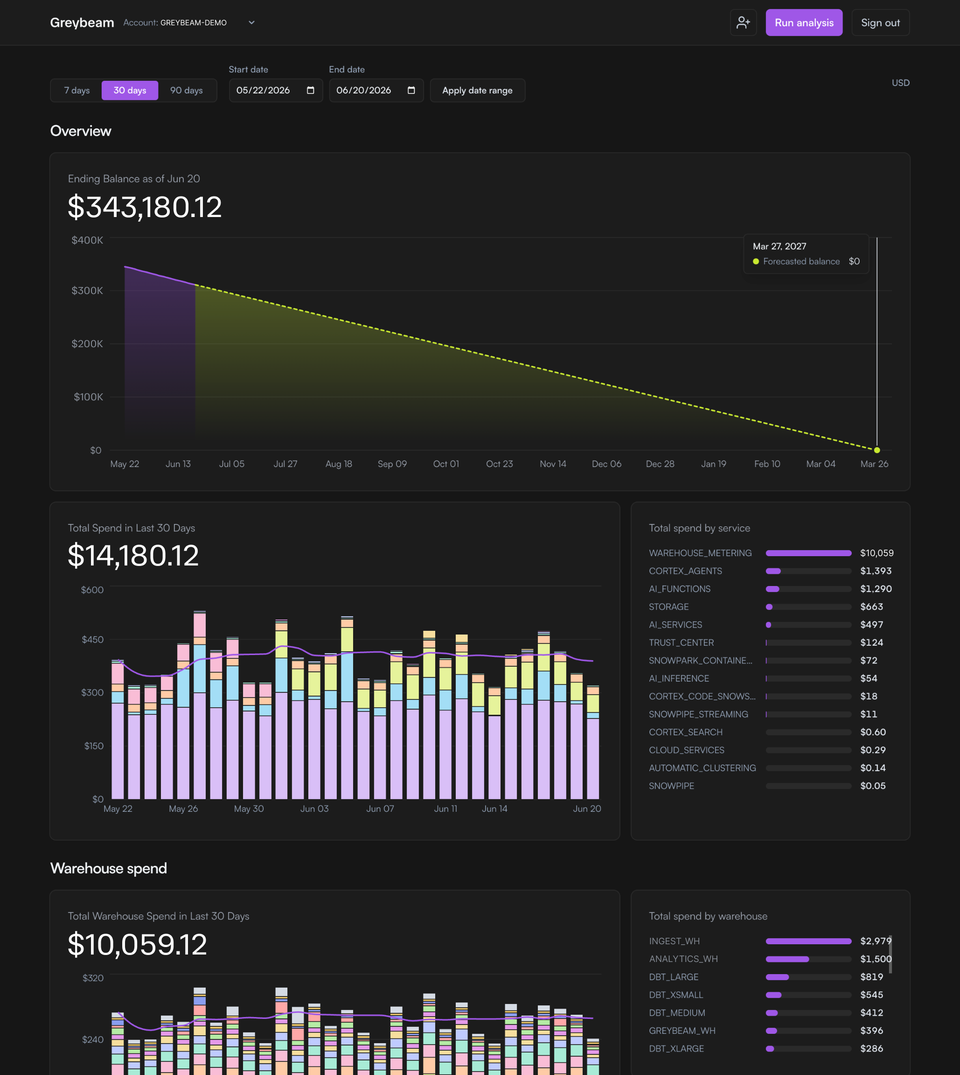
We work with a lot of teams running Snowflake, and most of them have narrow visibility into their costs. Finding out where you're spending usually means writing your own queries against the ACCOUNT_USAGE and ORGANIZATION_USAGE schemas and rebuilding the same charts every team ends up building.
Today we're releasing Greysight, an open-source dashboard for Snowflake cost observability. It runs the same read-only metadata queries you would write by hand (or with Coco) and turns them into a cost dashboard you can read in one place. It's completely free to use or can be self-hosted below.
The dashboard is fairly focused, but we plan on continually pushing updates to it.
Greysight Features
Warehouse Spend
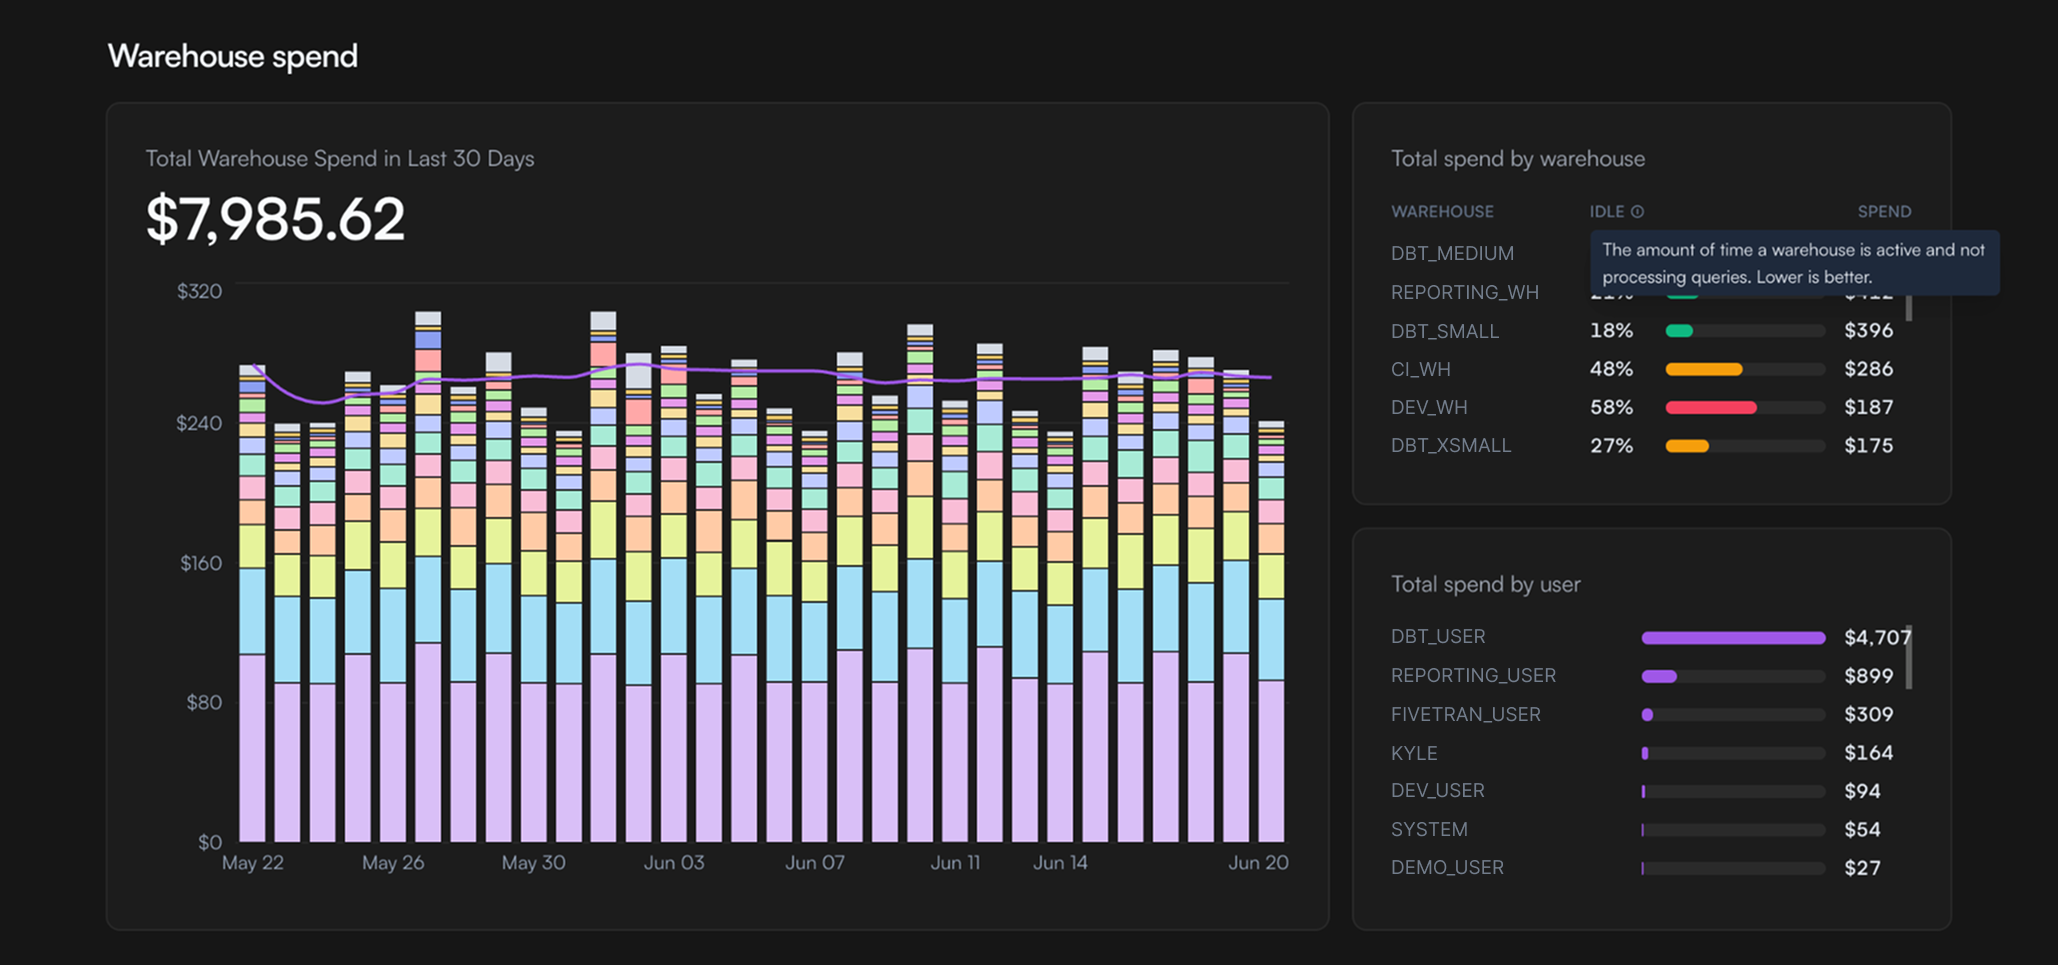
Spend by warehouse. This is a basic view from Snowflake's Cost Management tab but resolved to dollars. We've also added a 7-day rolling average to monitor the trend over time.
Spend by user. Greysight reads QUERY_ATTRIBUTION_HISTORY and attributes compute credits to users.
Idle warehouse percentage. Idle compute is the share of a warehouse's credits spent while it was running but not executing queries. For example, a query executes for 60 seconds, you have 60 seconds auto-suspend configured, and the warehouse suspends - this would show 50% idle. Snowflake reports the credits a warehouse consumed (credits_used_compute) and the credits it could attribute to queries (credits_attributed_compute_queries) separately, and the difference between them is idle. A high idle percentage means the warehouse is heavily underutilized and, depending on your setup, you should consider consolidating warehouses.
AI and Cortex spend
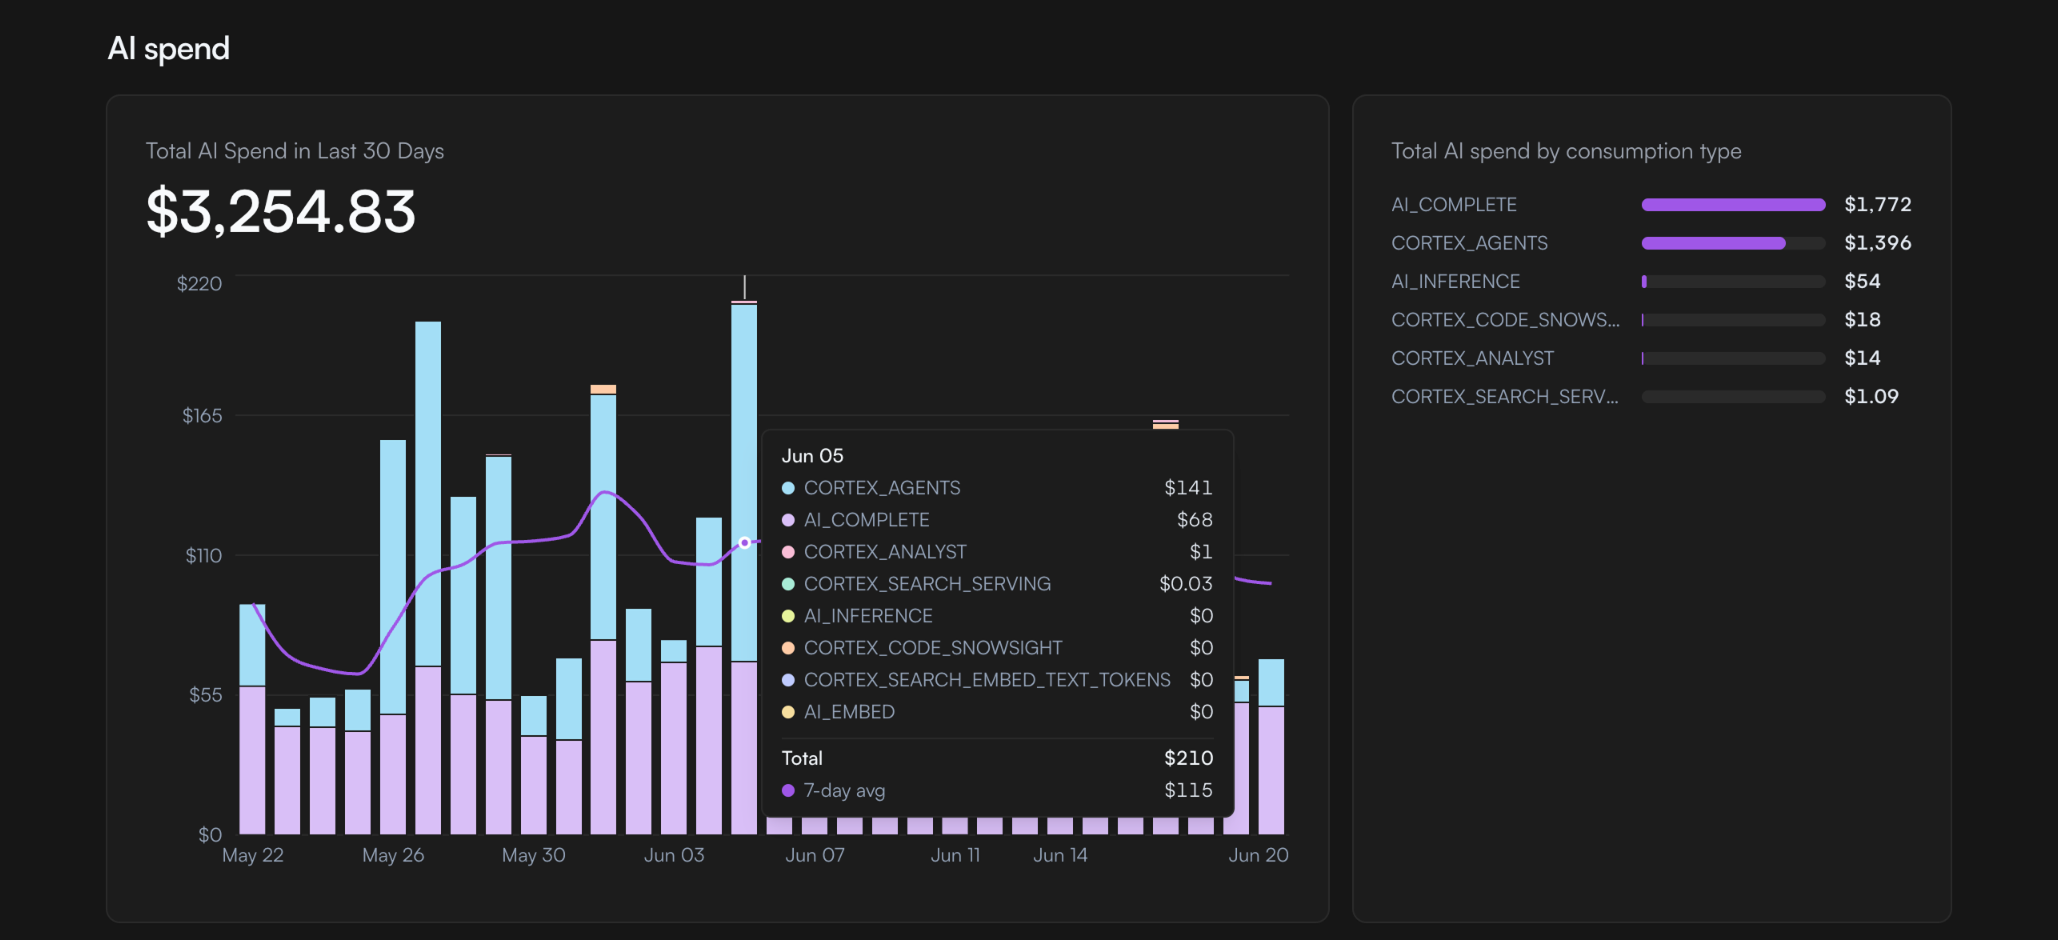
Cortex Analyst, Cortex Search, AI functions, document processing, fine-tuning, and agents each bill separately and each have their own usage view. Greysight combines them into a single holistic view, so you can track what these features cost as usage grows.
Storage Overview
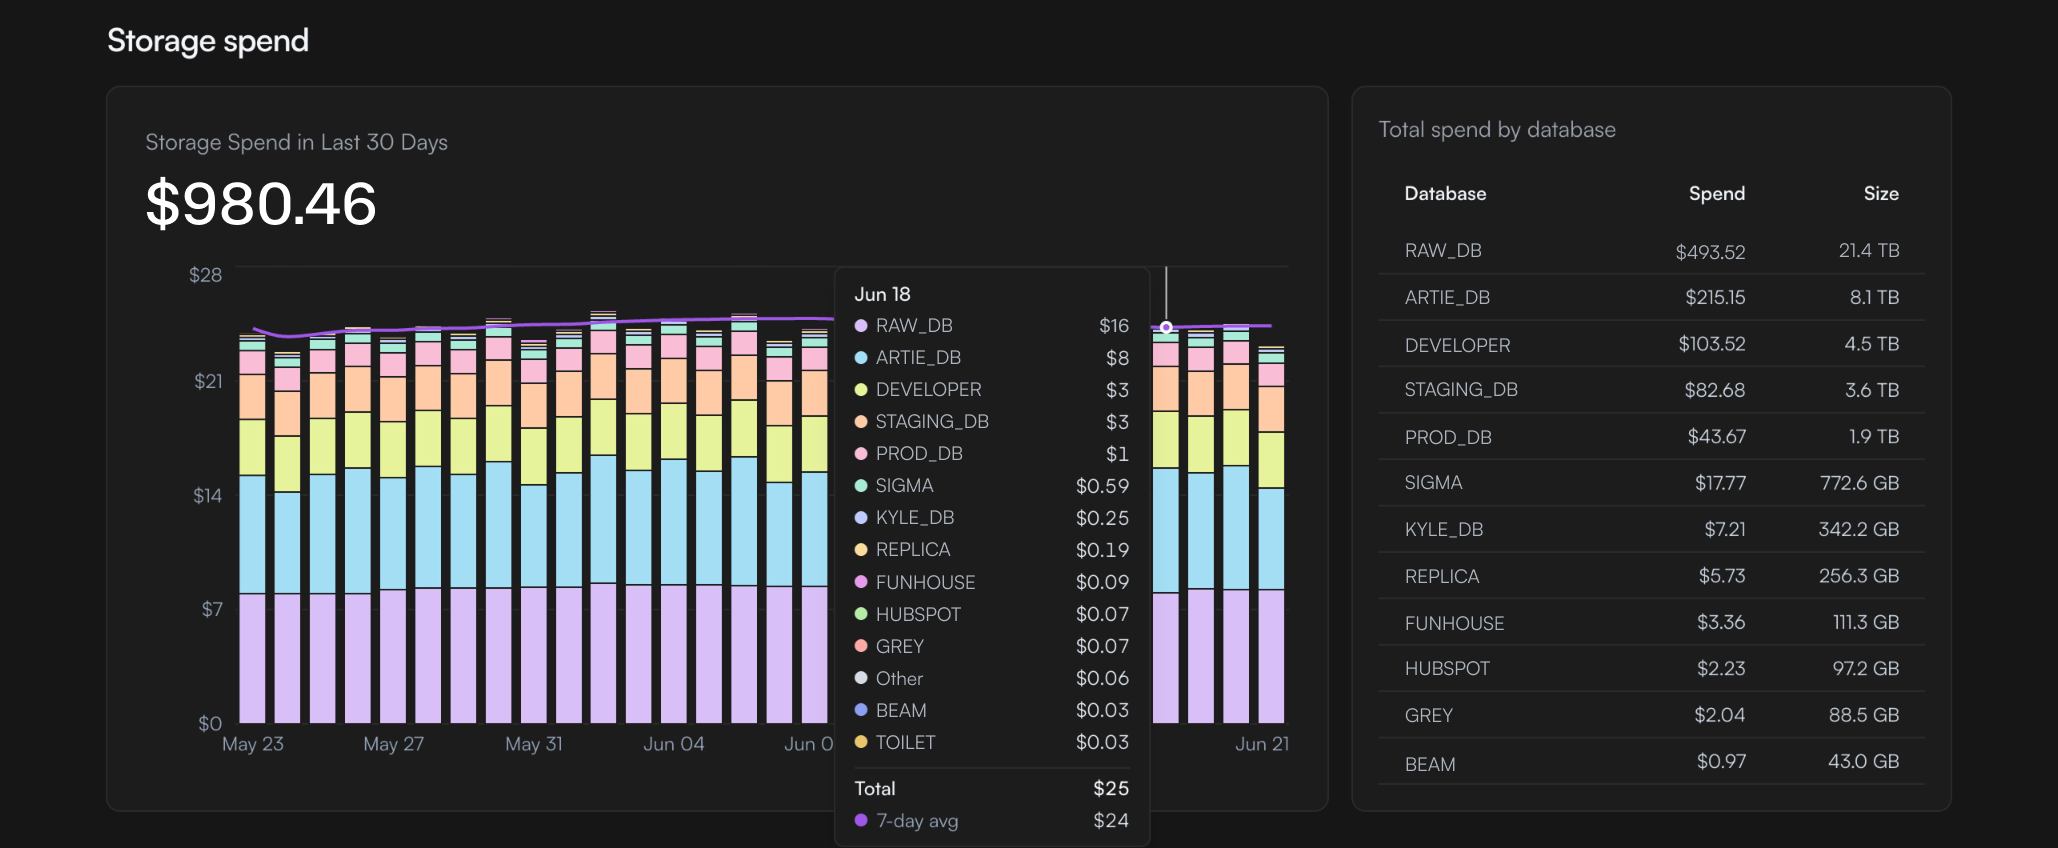
Storage by database across the window, so you can watch it grow over time instead of finding out on the bill.
Other Features
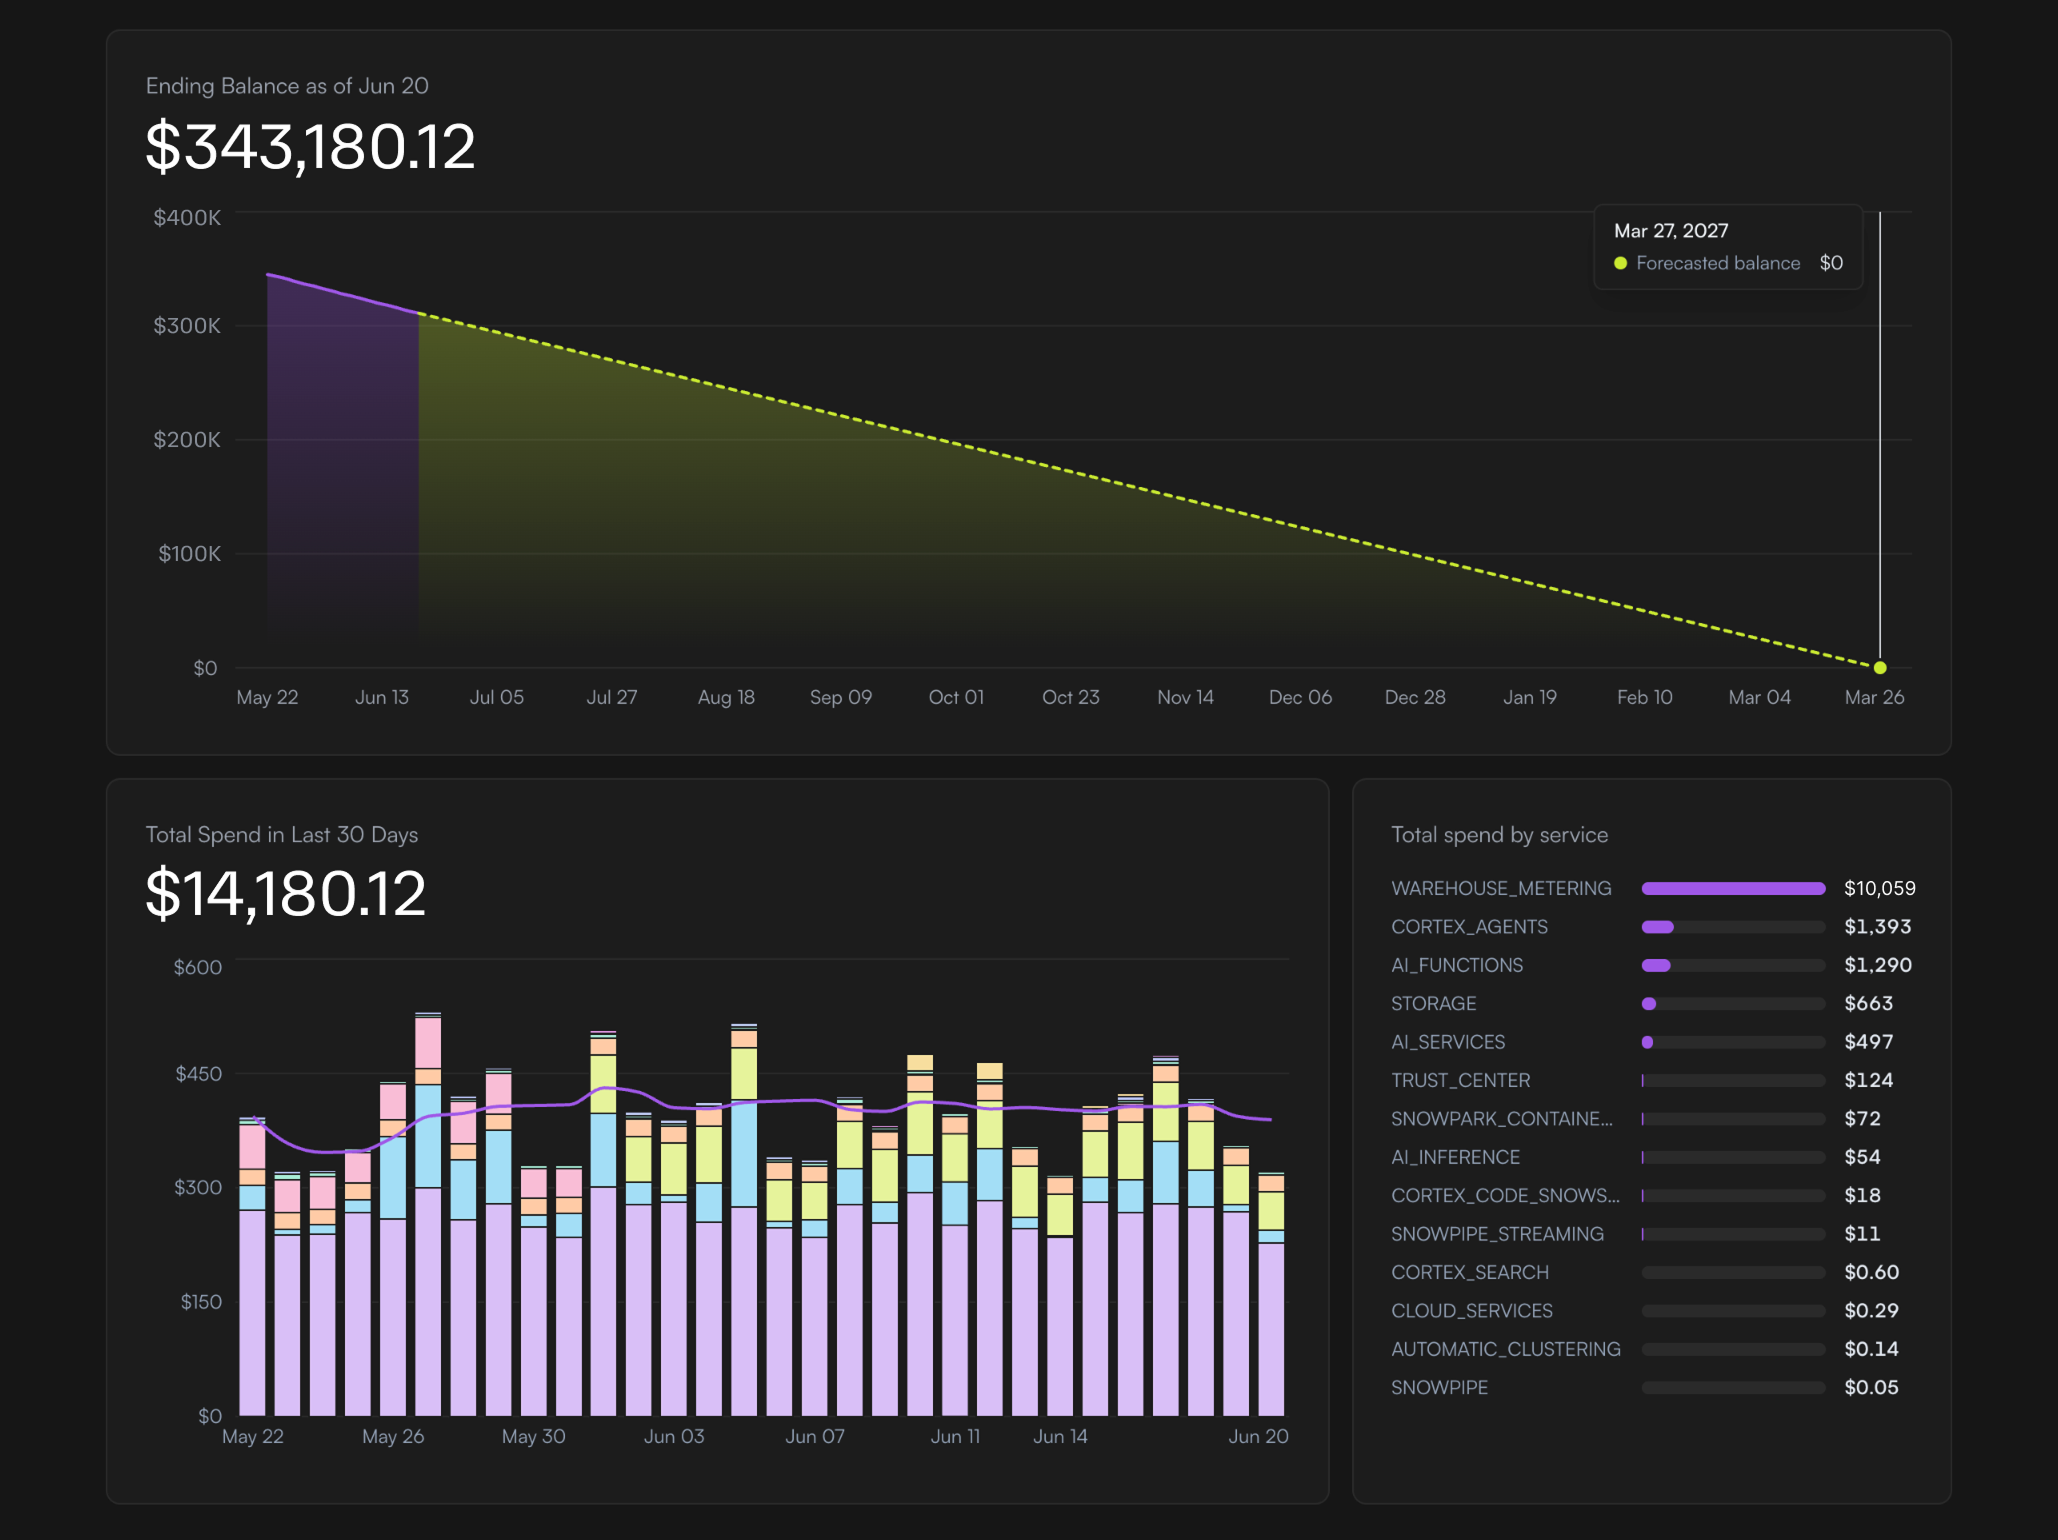
Ending-balance projection. Greysight reads your remaining capacity balance from ORGANIZATION_USAGE and projects it forward at your current rate. If you're on a capacity contract, it gives you an estimate of when the balance runs out.
Holistic view of all spend. Greysight provides a holistic view of all spend across every service type, so you can quickly determine the source of cost spikes.
Get started
The quickest way to try it is the hosted version. Caching is available so that runs between teammates do not trigger fresh queries to the warehouse, the default expiration is set to 24 hours. We never store your data and only read metadata. Queries and accesses are completely auditable via the repo. Connect a read-only role and the dashboard is ready in a few minutes:
What's next
Greysight is at version 0.0.1, and it's deliberately narrow: a cost dashboard, not a recommendations engine. The areas we're working on next go deeper:
- Auto clustering overview. Auto clustering can be incredibly expensive. We want to show which tables are driving costs and how often they're running.
- Query performance deep dives. Moving from "this warehouse is expensive" to the specific queries driving the cost.
- Warehouse cluster usage. Multi-cluster scaling can quietly multiply spend. We want to show when clusters spin up and whether the concurrency justified it.
- Table clustering health. Clustering keys that drift out of order increase scan costs over time, and that's worth surfacing.
Because it's open source, the roadmap is open too. If the breakdown you need isn't there, the SQL sources are in the repo.
Why we built it
Greysight grew out of our own work at Greybeam, where we route eligible Snowflake queries to cheaper engines like DuckDB and reduce Snowflake costs by an average of 86%. We believe that observability should be a base requirement, especially if your costs are consumption based.
Please give Greysight a try and let us know what we should add.

Comments ()